Monday 19 December 2016

Chain Termination Sequencing

The environmental DNA has been amplified, the clone library has been built, but there's still one more step before we can start working out what was in our sample. Now we need to sequence the genes which are safely tucked away in the plasmids of the clone library.

Although chain termination sequencing has been largely superseded by Next Generation Sequencing techniques like pyrosequencing and the Illumina platform, it's a good place to start. It shares some characteristics with a lot of the more modern platforms and a lot of older material about microbial communities is based on these techniques.

Dideoxy Chain Termination (Sanger) Sequencing

Frederick Sanger developed this technique in 1977, and it remained the dominant method for 39 years. In its original form it was a very labour intensive process and many a PhD student spent long hours poring over electrophoresis gels to sequence viral genomes. However, once it was automated, it provided the basis for the Human Genome project. 

The method is very similar to PCR. You need template DNA, DNA polymerase, a primer and some nucleotides, but there are a few differences. Your initial DNA template is single stranded and you need to mix in a few dideoxynucleotides (ddNTPs) with your normal deoxynucleotides (dNTPs). A ddNTP lacks the hydroxyl group on the 3' carbon, making it impossible for another dNTP to bind to it. Once I've added a ddNTP to a DNA strand, that's it. It can't continue being replicated, it just stays as it is, it's been terminated.

Figure 1 - The structure of dNTPs (left) and ddNTPs (right). ddNTPs lack the hydroxyl groups which are needed for binding of further nucleotides.

Let's imagine that we stick the following template into the reaction:

ATCTGGATGCTGGATGGCCATATAGT

We add a mixture of normal dNTPs and some ddTTP to terminate the chain wherever there's a T nucleotide. We would end up with a mixture of the following fragments at the end:

AT
ATCT
ATCTGGAT
ATCTGGATGCT
ATCTGGATGCTGGAT
ATCTGGATGCTGGATGGCCAT
ATCTGGATGCTGGATGGCCATAT
ATCTGGATGCTGGATGGCCATATGT

Now we need to visualise what's in our sample... We know we can reliably separate different lengths of DNA using gel electrophoresis. Also, if we put a radioactive label on the ddNTP we can develop the gel and see where the fragments are in the gel. Run 4 different reactions and run them on adjacent gels, and you can read off the sequence (Figure 2).

Figure 2 - Gel electrophoresis of the products of 4 reactions with ddATP, ddTTP, ddCTP and ddGTP allows for the sequencing of the initial DNA fragment.

This original method was very time consuming both in calibrating the reaction and electrophoresis, and manually reading the sequence off the gels. Luckily, it lends itself nicely to automation. Replace the radioactive tag with a fluorescent one, and you can run 4 reactions in one and still differentiate between the 4 different nucleotides that were added. Teach a computer that green = A, red = T, yellow = G, blue = C and you can multiply the productivity by many orders of magnitude. 

This technology was eventually minituarised so it could run in a capillary tube and be fully automated in a machine. The machines pictured below can run 96 capillaries at the same time.

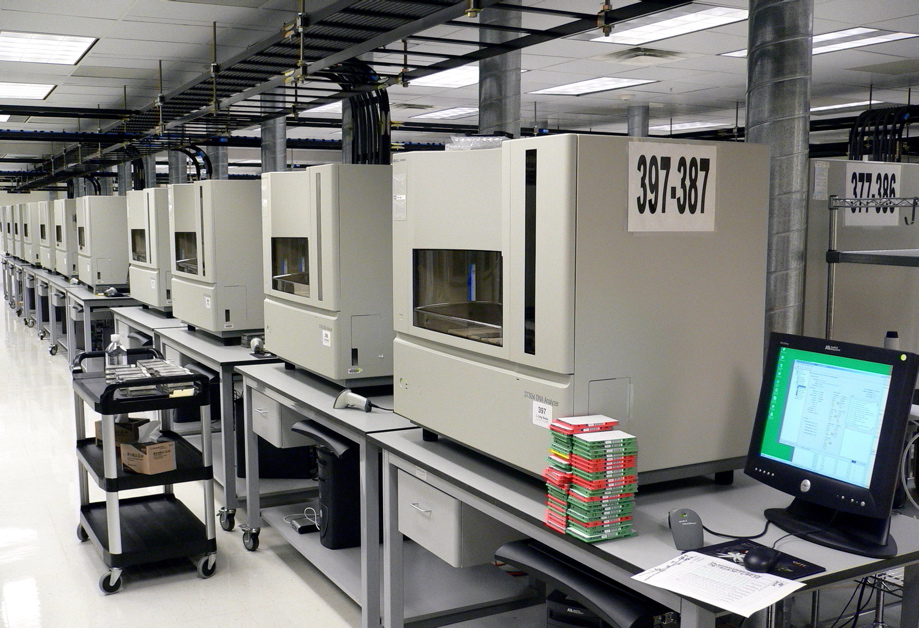
Flickr user jurvetson, DNA-Sequencers from Flickr 57080968, CC BY 2.0
Sanger sequencing remains relevant, and if anything is more accurate, but it can't provide the depth that NGS techniques can. While each machine pictured above can sequence 96 pieces of DNA at a total rate of about 6Mb (Megabase, 1,000 bases) per day (1), a modern Illumina machine can sequence millions of DNA fragments.

Why don't we use Sanger Sequencing anymore?

The error rate for Sanger sequencing tends to be pretty low, with one error for every 10,000 to 100,000 nucleotides sequenced (1). As with other sequencing platforms, the error rate increases with longer DNA fragments. NGS techniques have higher error rates than Sanger sequencing. So why has it been replaced? The quick answer is cost and throughput. Microbiome research, especially metagenomics and proteomics, involves sequencing all the DNA in a sample. That's a massive amount of data and would take much longer using chain termination sequencing machines. Sanger sequencing costs about $500/Mb of sequencing to produce 6Mb of data per day. If you use pyrosequencing you can get 750Mb for $20/Mb. Illumina sequencing will provide me with 5000Mb and only cost me $0.50/Mb (1). Sanger sequencing has its place, but that place is no longer in microbial community research.

However, if you're reading a paper about clone library analysis which has used chain termination sequencing, then you can be pretty sure that the results that the sequences that they've produced are fairly accurate. You'll still have to bear in mind the errors and biases introduced by lysis, extraction, PCR and clone library preparation, but sequencing is unlikely to have skewed the data very much.

Of course, the key to clone libraries is analysing the sequence data which is produced. Drawing phylogenetic trees and interpreting diversity indices, amongst other things. This will be the focus of the next post.

Reference
1. High-throughout DNA sequencing - Concepts and limitations. Kircher, M., Kelso, J. Bioessays. 2010; 32(6):524-536.

Saturday 10 December 2016

Building Clone Libraries

Let's have a look at the Materials and Methods of a paper:

"Microbial Community Composition of the Ileum and Cecum of Broiler Chickens as Revealed by Molecular and Culture-Based Techniques"

There's a PDF copy here.

First they describe the animals used, what they were fed, how they were kept, etc. Then there's a bit about culturing some bacteria. They extract and purify their DNA, then go to talk about 16S rDNA Amplification and Cloning. There's a big bit about PCR, so far so good... but then there's this part:

"The products were then purified using a QIAquick PCR purification kit (Qiagen GmbH, Hilden, Germany) and stored at −20°C. The blunt-end PCR products were cloned into linearized pCR-blunt vectors (Invitrogen, Carlsbad, CA), and 1 shot TOP10 competent Escherichia coli cells were transformed using a Zero Blunt PCR cloning kit (Invitrogen) according to the manufacturer’s instructions. Cells were grown on low-salt Luria-Bertani (LB) agar plates (Invitrogen) for 18 to 24 h at 37°C. Colonies were picked randomly and transferred to 1.3 mL SOB-Zeocin medium (Invitrogen) and grown for 24 h at 37°C. Plasmids were purified using a QIAprep 96 Turbo Miniprep kit (Qiagen) using a QIAvac vacuum manifold"

Here's another paper:

"Diversity and Succession of the Intestinal Bacterial Community of the Maturing Broiler Chicken" (PDF)

"The amplified PCR products were purified with the Wizard PCR product purification kit (Promega, Madison, Wis.). The purified products were ligated into pGEM-T Easy (Promega). Ligation was done at 4°C overnight, followed by transformation into competent E. coli JM109 cells by heat shock (45 s at 42°C). The clones were screened for α- complementation of β-galactosidase by using X-Gal (5-bromo-4-chloro-3-indolyl- -D-galactopyranoside) and IPTG (isopropyl- -D-thiogalactopyranoside) (5)." ... "DNA preparations for sequencing were made with the QIAprep spin plasmid kit (Qiagen, Valencia, Calif.) as specified by the manufacturer. Plasmids were eluted with 50 μl of water and stored at 70°C."

What does it mean? One paper's using QIAquick, another one's talking about Wizard. There's some E. coli getting involved there as well... It's confusing. Actually those little paragraphs underlie a lot of lab work.

What is a Clone Library anyway?

Clone libraries are a method of separating rDNA from a PCR sample and creating enough copies to sequence. The basic premise is that rDNA fragments amplified by PCR are inserted into vector DNA (usually plasmids, a loop of DNA commonly found in bacteria), which are then taken up by Escherichia coli. In this context, "competent" means that the bacteria is able to undergo "Transformation" or take up DNA from another source and replicate it. The bacteria are plated out and screened in such a way that each colony on a plate is made up of bacteria carrying a vector with the same bit of rDNA. These can be cultured further to provide enough plasmids to sequence the inserted rDNA or stored for later analysis.

User:Spaully on English wikipedia, Plasmid (english), CC BY-SA 2.5
Purifying DNA from PCR

Although this step is considered optional, it can improve cloning results. At the end of PCR, you've got lots of rDNA, but also lots of other crud from the reactions like primers and enzymes. These and other nonspecific products of PCR can be separated from amplified 16S rDNA using agarose gel electrophoresis (1) or a commercial kits like Wizard or QIAquick⁠. 

Sticky vs Blunt ended PCR products

PCR using Taq polymerase will leave what is known as an A-overhang artefact on amplified DNA. This is an A residue attached to the 3 end of DNA string. This A-overhang is exploited in some commercial cloning kits to insert amplified rDNA into vector DNA with a complementary T-overhang (TA cloning) (2,3)⁠. This is a "sticky ended PCR product". It should be noted that purification of PCR products using agarose gel electrophoresis removes the A-overhang, so a short step of 3 adenylation is required after purification (1)⁠.


Vishnu2011, Tacloning, CC BY-SA 3.0
If you haven't used Taq polymerase, you don't have the A-overhang so your PCR products are blunt ended.

Vector DNA
The purpose of vector DNA is to stabilise and replicate an rDNA molecule within a bacterial host. All vector DNA must:

  1. Be able to replicate along with the inserted PCR amplicon.
  2. Contain unique restriction endonuclease cleavage sites.
  3. Contain a marker to distinguish vectors with inserted rDNA, and also distinguish between hosts without vectors.
  4. Be relatively easy to extract from the host cell (4)⁠.
The procedure for creating a clone library is outlined in the figure below.


1. Plasmids are mixed with 16S rDNA sequences (iii) and the two spliced together. The insertion point for the 16S rDNA is in the lacZ gene, which codes for the α subunit of β-galactosidase enzyme (ii). This results in insertional inactivation of the lacZ gene (2)⁠. The method for inserting the 16S rDNA into the plasmid will depend on the commercial kit which is being used. The plasmid also contains a gene for antibiotic resistance (i).

2. After insertion of 16S rDNA, the sample contains two kinds of plasmids: Plasmids with the 16S rDNA insertion (i) and plasmids without the 16S rDNA insertion (ii).

3. Escherichia coli are used as host bacteria and are stimulated to take up the plasmids. After this step, there is a mixture of 3 types of E. coli: Those with plasmid type (i), those with plasmid type (ii) and those with no plasmid (iii).

4. The bacteria are then cultured on a media treated with antibiotics to exclude bacteria type iii (2, 3). The media also contains an inducer for the lacZ gene (so it's expressed) and a substrate for β-galactosidase which turns blue when broken down. Colonies of bacteria which still have an competent lacZ gene due to failure of rDNA insertion into the plasmid will turn blue, allowing for selection of bacteria with a type (i) plasmid (2)⁠.

5. Bacteria from selected colonies are grown overnight in nutrient broth.

So there we have it! Now we've got a theoretically unlimited supply of our 16S rDNA which we extracted from the environmental sample and amplified using PCR. We can now extract the plasmid and inserted DNA using a commercial kit and then sequence it. But wait, as with any technique there are caveats...

Biases of Cloning


There is only one report of a potential bias introduced during the cloning procedure. This focused on comparing the two methods of inserting the 16S rDNA sequences into the plasmid vector, blunt end and sticky end cloning. It was reported that the two methods produced different results when screened using dot-blot hybridisation, however, no phylogenetic details are provided so it is difficult to draw conclusions (5)⁠.

Remember those Heteroduplexes and Chimeras?

Clone libraries may exacerbate the problem of heteroduplex molecules produced during PCR. During cloning in the host bacteria, E. coli DNA repair mechanisms identify the heteroduplex and attempt to repair the mismatched bases. In normal cells, DNA methylation identifies one strand as the correct parent strand. Since neither strand of the inserted DNA is methylated, the repair mechanisms randomly choose one to use a template. For each incorrect base pair, a different strand may be used as the template. The repaired sequences that result are composites of two original strands, referred to as ‘mosaics’ (6)⁠. These are harder to identify than chimeras and so will artificially increase the apparent phylogenetic diversity of a clone library.

Chimeras also present a problem when analysing clone libraries. An analysis of 17 large clone libraries (100 or more clones) of 16S rRNA genes submitted to public databases in 2005 found an average chimera content of 9.0% with one library containing 45.8%. Nine of the libraries had already been checked for chimeras using software (7)⁠. This highlights the importance screening sequences from PCR using reliable chimera hunting software.

How Reliable are Clone Libraries?

As a result of these biases, and those introduced previously by DNA extraction and PCR, it is worth questioning whether clone libraries provide an accurate representation of the qualitative and quantitative composition of microbial communities. Analysis of clone libraries must be viewed objectively and considered as only part of the puzzle of microbial ecology (8)⁠.

Most studies using clone libraries will examine no more than 100 clones, and while this may identify the main taxa present, it is unlikely to represent the true diversity of the orginal sample (8)⁠. While the clone library may not represent true diversity, they benefit from producing longer 16S rDNA fragments for sequencing which provide a greater phylogenetic resolution. Comparing results from different clone libraries is often confounded by the use of different hypervariable regions of 16S rDNA. In light of this, the results of studies using clone libraries should be considered as a semi-quantitative analysis which only superficially explore the true diversity of microbial communities (8)⁠.

References

1. Leigh MB, Taylor L, Neufeld JD. Clone Libraries of Ribosomal RNA Gene Sequences for Characterization of Bacterial and Fungal Communities. Handbook of Hydrocarbon and Lipid Microbiology. 2010. p. 3971–90.


2. Osborn M a, Smith CJ. Molecular Microbial Ecology. Vol. 51. 2009. 370 p.


3. Makkar, H. P S MCS. Methods in Gut Microbial Ecology for ruminants. 2005. 1-223 p.

4. Mullis KB. Recombinant DNA technology and molecular cloning. Sci Am. 1990;Chapter 8:26.


5. Rainey F a., Ward N, Sly LI, Stackebrandt E. Dependence on the taxon composition of clone libraries for PCR amplified, naturally occurring 16S rDNA, on the primer pair and the cloning system used. Experientia. 1994;50(9):796–7.
 
6. Thompson JR, Marcelino L a, Polz MF. Heteroduplexes in mixed-template amplifications: formation, consequence and elimination by “reconditioning PCR”. Nucleic Acids Res. 2002;30(9):2083–8.

7. Ashelford KE, Chuzhanova NA, Fry JC, Jones AJ, Weightman AJ. New screening software shows that most recent large 16S rRNA gene clone libraries contain chimeras. Appl Environ Microbiol. 2006;72(9):5734–41.
 
8. Stackebrandt E, Pukall R, Ulrichs G, Rheims H. Analysis of 16S rDNA clone libraries: part of the big picture. Proc 8th Int Symp Microb Ecol Microb Biosyst new Front Atl Canada Soc Microb Ecol Halifax, Nov Scotia, Canada [Internet]. 1999;1–9

Friday 2 December 2016

PCR Biases - Differential Amplification

As well as telling us how many bacterial species make up a microbial community, 16S rRNA gene analysis can give us an idea of the abundance of each species. It would be great if things were simple. Let's say I analyse 100 sequences from an environmental sample. My analysis shows that 50 sequences are from the phylum Firmicutes, 30 are Proteobacteria and 20 belong to Bacteroidetes. So logically, I can assume that of all the bacteria in the sample 50% are Firmicutes, 30% are Proteobacteria and 20% are Bacteroidetes. However, if I've used PCR to amplify the DNA in my sample, I have to assume that all of the genes are amplified equally. This assumption is wrong. Some sequences will be easier to copy using PCR than others. This discrepancy is called differential or preferential amplification. Differential amplification is a bias introduced by PCR which cannot always be corrected. Several factors have been identified as causing differential amplification of rDNA.

  1. The rRNA gene copy number (rrn operon number) and genome size differ between species.
      Bacteria can have between 1 and 10 copies of the rRNA gene within their genome (1)⁠. What’s more, the copy number of rRNA genes doesn’t necessarily correspond to a regular increase in PCR product so even if we knew the rrn operon number of each species, we couldn't correct for it. Other factors such as density of rRNA genes and the percentage of the genome composed of rRNA genes have also been theorised to affect the efficiency of PCR amplification (2,3)⁠. There are online databases that have information on the rrn operon number of different bacterial species. For example, here we can see that Lactobacillus acidophilus has 4  16S rRNA gene copies in its genome, according to two different studies.

  2. Not all rRNA genes from the same species have exactly the same sequence.
      By reviewing pairs of sequences from the same species in databases of rRNA gene sequences, it has been estimated that up to 48% of sequence pairs have more variation than would be expected from sequencing errors. This variation is different between taxa, so there is no easy mathematical correction for this observation (4)⁠. Another study of differences in sequence found that 16S rRNA gene sequences from strains of Paenicabillus polymyxa differed from each other by one to eight nucleotides at ten places in the V6 to V8 regions (5)⁠. Intraspecific heterogeneity (differences within the same species) can complicate the quantification of bacteria and lead to an overestimation of diversity (1, 2)⁠.

  3. Differences in G+C content between sequences
      The G-C content of a DNA sequence is the proportion of base pairs that are G-C instead of A-T. The G-C content is important as it defines how stable a DNA molecule will be at higher temperatures. This is the central tenant on which temperature and denaturing gradient gel electrophoresis separates DNA molecules based on their sequences. Basically, DNA molecules with a higher G-C content are more thermostable than those with a low G-C content. This is because of the stacking of the base pairs, which is beyond the scope of this article, but keen biochemists can read up about it here. rDNA sequences that have a lower G+C content denature in the PCR and so may be preferentially amplified. This effect can be reduced by adding 5% acetamide which also stops primers from binding preferentially to different DNA strands (6)⁠.


      The top strand has a lower G-C content than the bottom one and so will denature more readily.
  4. Sequences outside the rRNA gene can inhibit amplification.
      Other DNA sequences and secondary structural features of the bacterial genome that serves as the original template can inhibit PCR amplification of the rRNA gene.  DNA isn't a straight molecule. It curls up on itself and has other proteins bound to it. These secondary structural features can physically get in the way of primer binding. The inhibitory effect of these secondary structures varies depending on which variable section is targeted by the primers (7–9)⁠. One group found they couldn't overcome the inhibitory effect of  by using DNA denaturing cosolvents such as DMSO and glycerol or other techniques such as touchdown PCR. Instead, they suggested that the effect can be minimised by using at least two primer sets targeting different variable sections of the rRNA gene in separate PCRs, then comparing the results (7)⁠.

      A strand of DNA wrapped around a DNA binding protein which could obstruct PCR amplification
      Thomas Splettstoesser, Nucleosome1, CC BY-SA 3.0
  1. Increasing template concentration reduces the rate of amplification.
      In the typical description of PCR, the DNA strands denature and the primer binds. But what's stopping the DNA strands from just reannealing to each other instead of a primer once the temperature drops? The answer is... nothing, except that usually the other DNA strand has floated away a bit and the nearest thing to bind to is a primer. However, a critical concentration of template DNA exists at which reannealing of DNA strands is favoured over primer binding. When the concentration of template DNA reaches and goes over this critical concentration, amplification is reduced. This allows other rDNA templates to be more effectively amplified in subsequent PCR cycles and will alter the relative abundance of rDNA sequences within the sample. This amplification bias is less likely to occur in samples with a wide variety of rDNA sequences at relatively low concentrations (9)⁠.

  2. Specificity of primers to the template DNA.
      Even if universal primers are used, there is evidence to suggest that there is differential binding between primers and template DNA from different bacterial species. Even single mismatches between primers and template DNA can reduce binding (10)⁠. Suboptimal binding will result in decreased amplification of the respective template compared to others (11)⁠. While lowering the annealing temperature will allow for mismatches, it can increase non-specific primer binding and unwanted products (12)⁠.
  1. DNA contamination of PCR.
      Introduction of DNA to the sample can occur either through unintentional transfer of DNA from previous amplifications (tube-to-tube contamination) or by contamination of PCR reagents (11)⁠. This is a particular problem for reagents such as DNA polymerase whose manufacture involves the use of Escherichia coli (1)⁠. To protect against this, a negative control must always be included which is handled the same as other samples, except that no template DNA is added. Reagents should also be pre-treated with UV light or uracil DNA glycosylase to remove contaminating DNA (13)⁠.
Let's have a look at this paper investigating poultry intestinal bacteria using denaturing gel gradient electrophoresis. They have this to say about their PCR:

"Primers7 (50 pmol of each per reaction mixture; primer 2, 5′-ATTACCGCGGCTGCTGG-3′, and primer 3 with a 40-base G-C clamp (Sheffield et al., 1989; Muyzer et al., 1993), 5′-CGCCCGCCGCGCGCGGCGGGCGGGG CGGGGGCACGGGGGGCCTACGGGAGGCAGCAG- 3′) were mixed with Jump Start Red-Taq Ready Mix,5 according to the kit instructions, 250 ng of pooled (50 ng/ chicken) template DNA from five chickens in each group, and 5% (wt/vol) acetamide to eliminate preferential annealing (Reysenbach et al., 1992). Amplifications were on a PTC-200 Peltier Thermal Cycler8 with the following program: 1) denaturation at 94.9°C for 2 min; 2) subsequent denaturation at 94.0°C for 1 min; 3) annealing at 67.0°C for 45 s, −0.5°C per cycle [touchdown to minimise spurious by-products (Don, 1991; Wawer and Muyzer, 1995)]; 4) extension at 72.0°C for 2 min; 5) repeat steps 2 to 4 for 17 cycles; 6) denaturation at 94°C for 1 min; 7) annealing at 58.0°C for 45 s; 8) repeat steps 6 to 7 for 12 cycles; 9) extension at 72.0°C for 7 min; 10) 4.0°C final."

Although they've taken precautions (highlighted in bold) to minimise certain factors that contribute to differential amplification it's impossible to correct for others, such as a different rrn operon number or intraspecific heterogeneity. In light of this, any experiment using PCR will introduce some biases and won't produce a 100% accurate picture of the microbial community being studied.

Although PCR is an imperfect technique, it is currently the only reliable way of amplifying DNA from environmental samples. After amplification, the DNA from a sample can either be analysed directly using fingerprinting techniques such as DGGE, TGGE and T-RFLP or individual DNA fragments can be sequenced to identify the bacteria present and build phylogenetic trees. While modern sequencing platforms like Illumina and 454 pyrosequencing require no additional steps after PCR, older studies which relied on chain-termination sequencing had to build clone libraries of sampled DNA. The creation of a clone library is a lengthy process and can also introduce biases which affect results.

References

1. Osborn M A, Smith CJ. Molecular Microbial Ecology. Vol. 51. 2009. 370 p.

2. Stackebrandt E, Pukall R, Ulrichs G, Rheims H. Analysis of 16S rDNA clone libraries: part of the big picture. Proc 8th Int Symp Microb Ecol Microb Biosyst new Front Atl Canada Soc Microb Ecol Halifax, Nov Scotia, Canada

3. Farrelly V, Rainey F a, Stackebrandt E, Farrelly V, Rainey F a. Effect of genome size and rrn gene copy number on PCR amplification of 16S rRNA genes from a mixture of bacterial species . These include : Effect of Genome Size and rrn Gene Copy Number on PCR Amplification of 16S rRNA Genes from a Mixture of Bacterial S. 1995;61(7):2798–801.

4. Clayton RA, Sutton G, Hinkle Jr. PS, Bult C, Fields C. Intraspecific variation in small-subunit rRNA sequences in GenBank: why single sequences may not adequately represent prokaryotic taxa. Int. J. Syst. Bacteriol. 1995;45:595–9.

5. Nubel U, Engelen B, Felske A, Snaidr J, Wieshuber A, Amann RI, et al. Sequence Heterogeneities of Genes Encoding 16S rRNAs in Paenibacillus polymyxa Detected by Temperature Gradient Gel Electrophoresis. J Bacteriol. 1996;178(19):5636–43.

6. Reysenbach AL, Giver LJ, Wickham GS, Pace NR. Differential amplification of ribosomal RNA genes by polymerase chain reaction. Appl Env Microbiol [Internet]. 1992;58(10):3417–8.

7. Hansen MC, Tolker-Nielsen T, Givskov M, Molin S. Biased 16S rDNA PCR amplification caused by interference from DNA flanking the template region. FEMS Microbiol Ecol. 1998;26(2):141–9.

8. Rainey F. A., Ward N, Sly L. I., Stackebrandt E. Dependence on the taxon composition of clone libraries for PCR amplified, naturally occurring 16S rDNA, on the primer pair and the cloning system used. Experientia. 1994;50(9):796–7.

9. Suzuki MT, Giovannoni SJ. Bias caused by template annealing in the amplification of mixtures of 16S rRNA genes by bias caused by template annealing in the amplification of mixtures of 16S rRNA genes by PCR. 1996;62(2):2–8.

10. Dahllöf I. Molecular community analysis of microbial diversity. Curr Opin Biotechnol. 2002;13(3):213–7.

11. Wintzingerode F, Göbel UB, Stackebrandt E. Determination of microbial diversity in environmental samples: pitfalls of PCR-based analysis. FEMS Microbiol Rev. 1997;21:213–29.

12. Ishii K, Fukui M. Optimization of Annealing Temperature to Reduce Bias Caused by a Primer Mismatch in Multitemplate PCR. Appl Environ Microbiol. 2001;67(8):3753–5.

13. Niederhauser C, Höfelein C, Wegmüller B, Lüthy J, Candrian U. Reliability of PCR decontamination systems. Genome Res. 1993;4(2):117–23.

Saturday 26 November 2016

PCR Artefacts

PCR artefacts are DNA sequences produced by errors in the PCR process. Some only involve changing one base pair, but some are severe enough to increase the diversity in subsequent analysis of the amplified DNA. It's important to take steps to minimise these errors and identify sequences that might be the result of PCR errors rather than actual bacteria.

Errors in Replication

The amplification of DNA is a laboratory imitation of DNA replication, and so is subject to the same errors. Since DNA polymerase is not 100% accurate, point mutations (where the incorrect base is added) and deletions can occur which will alter the replicated sequence from its original template. This error will then be amplified and may appear in results as a different sequence, especially when using techniques which can identify single nucleotide differences between sequences. The observed error rate for Taq DNA polymerase during PCR depends on the reaction conditions, and varies between one error per 290 nucleotides to one error per 5411 nucleotides (1)⁠. The error rate also differs between DNA polymerases, for example using Pfu instead of Taq DNA polymerase leads to a 10-fold improvement in the error rate (2)⁠. Reading errors will also increase with the number of PCR cycles, so it is worth keeping the cycle number to a minimum.

PCR is Blind

When someone describes PCR and how it works, it sounds like a very orderly affair. The DNA strands nicely denature, the primers form a queue and bind, replication occurs and then the corresponding DNA strands join back together again, ready for the next cycle. This makes for a nice explanation, but of course it's not like that in reality. In reality it's a messy, messy process. There's a whole load of molecules bumping around in your reaction vessel. DNA spends most of its time in a double stranded form. Double stranded DNA is a very stable structure and molecules like to be stable. A single stranded DNA molecule is the neediest molecule you'll ever find, it just wants stability! Surely this is something we can all relate to. If the perfect complementary strand isn't nearby a similar sequence will do. Equally, your PCR machine won't wait patiently for all of the DNA polymerases to finish replicating their strands of DNA. If they're not done by the time the temperature changes, then it's tough titties and you end up with a partial sequence floating around. This can lead to some really funny DNA sequences cropping up when you sequence everything.

Let's imagine we have two 16S rRNA genes in our PCR, A and B:

Heteroduplexes

The formation of heteroduplexes during PCR presents a problem. Heteroduplexes are double-stranded DNA molecules formed of single strands from different sources. As PCR progresses, you get more and more template DNA, but there are the same number of primers. The primer:template ratio decreases and can reach a point where primer annealing is no longer favoured. As we said earlier, DNA loves to bind to other bits of DNA. If there's not the perfect match nearby, either the complementary strand or a primer, it'll take what it can get. This leads to hybridisation of heterologous (from a different organism) template DNA and the formation of heteroduplexes. Heteroduplexes can increase the number of bands if the sampled is analysed using DGGE or TGGE, and introduce biases during the construction of clone libraries (3)⁠. Various methods for reducing heteroduplex formation have been proposed. These include the addition of more Taq polymerase after the 27th cycle, limiting the cycle number (4)⁠ and 10-fold dilution of the PCR product followed by three cycles of re-amplification (3)⁠.


Chimeras

Chimeras are more troublesome artefacts. They occur when a partial 16S rDNA fragment from the extension phase binds to a heterologous fragment during the annealing phase to form a heteroduplex. The incomplete fragment then acts as a primer for extension, creating a chimera of two 16S rRNA genes from different species. This is then amplified and can be easily confused as originating from a new, but unfortunately non-existent, bacterial species. Amplification of 16S rDNA is prone to the formation of chimeras because of the conserved regions of the gene. PCR amplification of 16S rDNA can produce between 5.4 and 8.6% chimeras (5)⁠. 


The frequency of chimera formation increases with:
  • The availability of partial rDNA fragments (6)⁠.
  • Damage to DNA by restriction enzymes, UV irradiation, sonication, depurination and rigorous cell lysis (7, 8).
  • The percentage similarity between DNA templates (9).
The incidence of chimera formation can be decreased by:
  • Increasing the elongation time (9, 10, 11).
  • Decreasing the number of cycles and thereby limiting the opportunity for formation and amplification of chimeras (5, 6)⁠.
Chimeras can also be identified after sequencing of amplified rDNA. Chimeric sequences are difficult to distinguish from true biological sequences, however, there are several computer programs which search for and identify chimeric sequences. Chimeras can also be identified by the production of incongruant trees following phylogenetic analyses on opposite ends of the rDNA sequences (6)⁠.

PCR artefacts are not the only problems with samples amplified using PCR. Not all DNA strands in the sample are amplified to the same extent, this is called differential amplification and is covered in another post.

References
  1. Eckert KA, Kunkel TA. DNA polymerase fidelity and the polymerase chain reaction. Genome Res. 1991;1(1):17–24.
  2. Lundberg KS, Shoemaker DD, Adams MWW, Short JM, Sorge JA, Mathur EJ. High-fidelity amplification using a thermostable DNA polymerase isolated from Pyrococcus furiosus. Gene. 1991;108(1):1–6.
  3. Thompson JR, Marcelino L a, Polz MF. Heteroduplexes in mixed-template amplifications: formation, consequence and elimination by “reconditioning PCR”. Nucleic Acids Res. 2002;30(9):2083–8. 
  4. Michu E, Mráčková M, Vyskot B, Žlůvová J. Reduction of heteroduplex formation in PCR amplification. Biol Plant. 2010;54(1):173–6.
  5. Wintzingerode F, Göbel UB, Stackebrandt E. Determination of microbial diversity in environmental samples: pitfalls of PCR-based analysis. FEMS Microbiol Rev. 1997;21:213–29.
  6. Osborn M A, Smith CJ. Molecular Microbial Ecology. Vol. 51. 2009. 370 p.
  7. Pääbo S., Irwin D. M. Wilson A. C. DNA damage promotes jumping between templates during enzymatic amplification. J. Biol. Chem. 1990;265:4721.
  8. Possemiers S, Verthé K, Uyttendaele S, Verstraete W. PCR-DGGE-based quantification of stability    of the microbial community in a simulator of the human intestinal microbial ecosystem. FEMS Microbiol Ecol. 2004;49(3):495–507.
  9. Wang GC, Wang Y. The frequency of chimeric molecules as a consequence of PCR co-amplification of 16S rRNA genes from different bacterial species. Microbiology. 1996 May;142 (Pt 5):1107-14.
  10. Shen J, Zhang B, Wei G, Pang X, Wei H, Li M, et al. Molecular profiling of the Clostridium leptum subgroup in human fecal microflora by PCR-denaturing gradient gel electrophoresis and clone library analysis. Appl Environ Microbiol. 2006;72(8):5232–8.
  11. Tourlomousis P, Kemsley EK, Ridgway KP, Toscano MJ, Humphrey TJ, Narbad A. PCR-Denaturing gradient gel electrophoresis of complex microbial communities: A two-step approach to address the effect of gel-to-gel variation and allow valid comparisons across a large dataset. Microb Ecol. 2010;59(4):776–86.

Friday 18 November 2016

The Polymerase Chain Reaction

Kary Mullis has an interesting section in his Wikipedia entry under "Extraterrestrial life". Apparently Mullis "reported an encounter with a glowing green raccoon at his cabin in the woods of northern California around midnight one night in 1985. He denies the involvement of LSD in this encounter." However, he does attribute his LSD use to his pioneering the Polymerase Chain Reaction. (PCR).

There were methods of synthesising small amounts of single-stranded DNA using DNA polymerase in laboratories before 1983. However, Mullis’ use of two oligonucleotide (short DNA molecules) primers, which target opposite strands of DNA to amplify a specific region, allowed for targeted and repetitive synthesis. Further modifications to the original procedure have converted PCR into an essential tool in a wide variety of fields, including diagnosis of infectious and genetic disease, as well as microbial ecology (1)⁠. Before the advent of PCR, DNA extraction from environmental samples could not yield enough 16S rRNA genes for a population analysis. Studies relied on the ability to culture bacteria, and then use 16S rRNA genes to identify the bacteria. PCR offered a way, once the correct primers had been identified, to amplify the 16S rRNA genes of all bacterial species in a sample to a level where they could be sequenced. Although PCR is not a perfect method its ability to amplify DNA signatures from uncultured organisms has added a whole new dimension to the analysis of microbial communities.

I'm in the middle of a chain reaction...

In any PCR, the reaction vessel must contain the following ingredients:
  • Template DNA - The DNA extracted from the sample.
  • A forward and reverse oligonucleotide primer pair - These are short strands of DNA. They will bind to any DNA which has the complementary sequence. PCR always uses two primers, a forward and a reverse (Figure 1). A paper using PCR primers will state the sequence of the primers they used and which gene they are designed to target.
Figure 1 - The primers are designed to flank the target DNA sequence, this allows for targeted replication.
  • A thermostable DNA polymerase - This is the enzyme which binds to the primers and attaches free nucleotides in the sequence determined by the template DNA.
  • Free deoxynucleotide triphosphates (dNTPs) - All 4 nucleotides (dATP, dCTP, dGTP, dTTP) that form DNA will need to be added.
  • Mg2+ ions - Some DNA polymerases need Magnesium ions to function. The concentration needs to be carefully calculated and calibrated (2)⁠.
The reaction vessel completes timed cycles of different temperatures at which different stages of DNA amplification take place. Each cycle has 3 stages:

  1. Denaturing of double-stranded DNA to form single-strands at 94 – 96°C.
  2. Annealing of primers (forward to the sense strand, reverse to the antisense strand) at a variable temperature.
  3. Extension of the DNA from the primers by DNA polymerase at 68 – 78°C (2)⁠.
Figure 2 - The PCR has 3 stages to each cycle: denaturing, annealing and replication.

The oligonucleotide primers are the most controllable variable of any PCR. They can also be the source of bias. Even if Firmicutes are the most abundant phyla in the environmental sample they will not be found on subsequent analysis if the primers don’t successfully bind to Firmicute DNA. As such, primer design is a major component of any microbial community study.

Primer Design

As mentioned before, the 16S rRNA gene is present in all organisms from the three domains: Archaea, Bacteria and Eukaryota. The nucleotide sequence can be divided into 9 hypervariable regions (termed V1 V9) flanked by conserved regions (3)⁠. Primers that target the 16S rRNA gene are designed to bind to the conserved regions, allowing for replication of the hypervaribale regions which can then be analysed depending on the goals of the study. A wide variety of primers can be chosen depending on whether researchers wish to amplify the entire gene, or just specific hypervariable regions.


There is no established nomenclature for primers but two systems are prevalent, a short and a long name. The long name uses the system proposed by Alm et al. in which each primer is named via 7 key features separated by hyphens, e.g. S-D-Bact-0008-a-S-20 (4)⁠. The short name consists of a number corresponding to the first base of the target sequence on the 16S rRNA gene, followed by either F (for forward) or R (for reverse). For example, the universal primers that amplify the entire 16S rRNA gene are 8F and 1492R (5-8)⁠. Short names may be followed by a -GC, which shows the presence of a GC-clamp used for denaturing and temperature gradient gel electrophoresis. The numbering system in both systems is based on the corresponding base from the 16S rRNA gene of Escherichia coli unless otherwise specified (4,9)⁠. The hypervariable regions have been identified as spanning (approximately) the following bases: 

V1 : 69 – 99                    V4 : 576 – 682             V7 : 1117 – 1173

V2 : 137 – 242                V5 : 822 – 879             V8 : 1243 – 1294

V3 : 433 – 497                V6 : 986 – 1043           V9 : 1435 – 1465


This can be used to identify which primers target which hypervariable region, for example 986F and 1401R will amplify the V6, V7 and V8 regions (10)⁠.

Let's have a look at a research paper that uses PCR. Here's the section about primers:

"The V3 region of the 16S rRNA genes (position 339–539 in the Escherichia coli gene) of bacteria was amplified using primers HDA1-GC (5'-CGC CCG GGG CGC GCC CCG GGC GGG GCG GGG GCA CGG GGG GAC TCC TAC GGG AGG CAG CAG T-3'; the GC-clamp is in boldface) and HDA2 (5'-GTA TTA CCG CGG CTG CTG GCA C-3')"

We can ignore the GC-clamp for now. So we have two primers and their sequences, but what does this actually correspond to? We can get the actual rRNA gene sequences for bacteria from the SILVA database and have a look to check if this sequence actually exists in real life, so below are the sequences for 2 species of bacteria from different phyla - Lactobacillus casei (a Firmicute) and everyone's favourite Escherichia coli (from Gammaproteobacteria).

AGTTTGATCATGGCTCAGGATGAACGCTGGCGGCGTGCCTAATACATGCAAGTCGAACGAGTTCTCGTTGATGATCGGTGCTTGCACCGAGATTCAACATGGAACGAGTGGCGGACGGGTGAGTAACACGTGGGTAACCTGCCCTTAAGTGGGGGATAACATTTGGAAACAGATGCTAATACCGCATAGATCCAAGAACCGCATGGTTCTTGGCTGAAAGATGGCGTAAGCTATCGCTTTTGGATGGACCCGCGGCGTATTAGCTAGTTGGTGAGGTAATGGCTCACCAAGGCGATGATACGTAGCCGAACTGAGAGGTTGATCGGCCACATTGGGACTGAGACACGGCCCAAACTCCTACGGGAGGCAGCAGTAGGGAATCTTCCACAATGGACGCAAGTCTGATGGAGCAACGCCGCGTGAGTGAAGAAGGCTTTCGGGTCGTAAAACTCTGTTGTTGGAGAAGAATGGTCGGCAGAGTAACTGTTGTCGGCGTGACGGTATCCAACCAGAAAGCCACGGCTAACTACGTGCCAGCAGCCGCGGTAATACGTAGGTGGCAAGCGTTATCCGGATTTATTGGGCGTAAAGCGAGCGCAGGCGGTTTTTTAAGTCTGATGTGAAAGCCCTCGGCTTAACCGAGGAAGCGCATCGGAAACTGGGAAACTTGAGTGCAGAAGAGGACAGTGGAACTCCATGTGTAGCGGTGAAATGCGTAGATATATGGAAGAACACCAGTGGCGAAGGCGGCTGTCTGGTCTGTAACTGACGCTGAGGCTCGAAAGCATGGGTAGCGAACAGGATTAGATACCCTGGTAGTCCATGCCGTAAACGATGAATGCTAGGTGTTGGAGGGTTTCCGCCCTTCAGTGCCGCAGCTAACGCATTAAGCATTCCGCCTGGGGAGTACGACCGCAAGGTTGAAACTCAAAGGAATTGACGGGGGCCCGCACAAGCGGTGGAGCATGTGGTTTAATTCGAAGCAACGCGAAGAACCTTACCAGGTCTTGACATCTTTTGATCACCTGAGAGATCAGGTTTCCCCTTCGGGGGCAAAATGACAGGTGGTGCATGGTTGTCGTCAGCTCGTGTCGTGAGATGTTGGGTTAAGTCCCGCAACGAGCGCAACCCTTATGACTAGTTGCCAGCATTTAGTTGGGCACTCTAGTAAGACTGCCGGTGACAAACCGGAGGAAGGTGGGGATGACGTCAAATCATCATGCCCCTTATGACCTGGGCTACACACGTGCTACAATGGATGGTACAACGAGTTGCGAGACCGCGAGGTCAAGCTAATCTCTTAAAGCCATTCTCAGTTCGGACTGTAGGCTGCAACTCGCCTACACGAAGTCGGAATCGCTAGTAATCGCGGATCAGCACGCCGCGGTGAATACGTTCCCGGGCCTTGTACACACCGCCCGTCACACCATGAGAGTTTGTAACACCCGAAGCCGGTGGCGTAACCCTTTTAGGGAGCGAGCCGTCTAAGGTGGGACAAATGATTAGGGTGAAGTCGTAACAAGGTAGCCGTAGGAGAACCTGCGGCTGGATCACCTCCTTA

AAATTGAAGAGTTTGATCATGGCTCAGATTGAACGCTGGCGGCAGGCCTAACACATGCAAGTCGAACGGTAACAGGAAGAAGCTTGCTCTTTGCTGACGAGTGGCGGACGGGTGAGTAATGTCTGGGAAACTGCCTGATGGAGGGGGATAACTACTGGAAACGGTAGCTAATACCGCATAACGTCGCAAGACCAAAGAGGGGGACCTTCGGGCCTCTTGCCATCGGATGTGCCCAGATGGGATTAGCTAGTAGGTGGGGTAACGGCTCACCTAGGCGACGATCCCTAGCTGGTCTGAGAGGATGACCAGCCACACTGGAACTGAGACACGGTCCAGACTCCTACGGGAGGCAGCAGTGGGGAATATTGCACAATGGGCGCAAGCCTGATGCAGCCATGCCGCGTGTATGAAGAAGGCCTTCGGGTTGTAAAGTACTTTCAGCGGGGAGGAAGGGAGTAAAGTTAATACCTTTGCTCATTGACGTTACCCGCAGAAGAAGCACCGGCTAACTCCGTGCCAGCAGCCGCGGTAATACGGAGGGTGCAAGCGTTAATCGGAATTACTGGGCGTAAAGCGCACGCAGGCGGTTTGTTAAGTCAGATGTGAAATCCCCGGGCTCAACCTGGGAACTGCATCTGATACTGGCAAGCTTGAGTCTCGTAGAGGGGGGTAGAATTCCAGGTGTAGCGGTGAAATGCGTAGAGATCTGGAGGAATACCGGTGGCGAAGGCGGCCCCCTGGACGAAGACTGACGCTCAGGTGCGAAAGCGTGGGGAGCAAACAGGATTAGATACCCTGGTAGTCCACGCCGTAAACGATGTCGACTTGGAGGTTGTGCCCTTGAGGCGTGGCTTCCGGAGCTAACGCGTTAAGTCGACCGCCTGGGGAGTACGGCCGCAAGGTTAAAACTCAAATGAATTGACGGGGGCCCGCACAAGCGGTGGAGCATGTGGTTTAATTCGATGCAACGCGAAGAACCTTACCTGGTCTTGACATCCACGGAAGTTTTCAGAGATGAGAATGTGCCTTCGGGAACCGTGAGACAGGTGCTGCATGGCTGTCGTCAGCTCGTGTTGTGAAATGTTGGGTTAAGTCCCGCAACGAGCGCAACCCTTATCCTTTGTTGCCAGCGGTCCGGCCGGGAACTCAAAGGAGACTGCCAGTGATAAACTGGAGGAAGGTGGGGATGACGTCAAGTCATCATGGCCCTTACGACCAGGGCTACACACGTGCTACAATGGCGCATACAAAGAGAAGCGACCTCGCGAGAGCAAGCGGACCTCATAAAGTGCGTCGTAGTCCGGATTGGAGTCTGCAACTCGACTCCATGAAGTCGGAATCGCTAGTAATCGTGGATCAGAATGCCACGGTGAATACGTTCCCGGGCCTTGTACACACCGCCCGTCACACCATGGGAGTGGGTTGCAAAAGAAGTAGGTAGCTTAACCTTCGGGAGGGCGCTTACCACTTTGTGATTCATGACTGGGGTGAAGTCGTAACAAGGTAACCGTAGGGGAACCTGCGGTTGGATCACCTCCTTA

So, we've found our Forward Primer, followed by the DNA we're going to replicate, note the differences between L. casei and E. coli which will help with identifying species and building phylogenetic trees. Finally there's the Reverse Primer. Now, remember DNA is double stranded, so what you see above is half the picture as it's the sequence of one strand. The Reverse Primer binds to the other strand of DNA, so what's highlighted is the complementary sequence for what's actually listed in the paper.

The best primers to use will be defined by the aims and methods used in the experiment. Typically, techniques for fingerprinting microbial communities like DGGE and terminal restriction fragment length polymorphism (T-RFLP) use DNA fragments of no more than 500 base pairs (11)⁠. Modern sequencing techniques are also limited by read length with higher throughput techniques often producing lower read lengths. 454 pyrosequencing produces read lengths of up to 700 base pairs, while Illumina sequencing only provides reads of 300 (although this system has the advantage of being able to sequence DNA at both ends of a strand). Since the 16S rRNA gene is roughly 1500 base pairs long, we must select which variable region to use in our analysis. Not all variable regions are of equal merit when identifying different bacterial genera and species, for example it has been reported that V2 was unable to distinguish between common Staphylococcal and Streptococcal pathogens, but provided the best region when analysing differences between Mycobacterial species (10)⁠. The same study concluded that regions V2 and V6 have the maximum nucleotide heterogeneity and therefore are the best regions for discriminating between a selection of 110 bacterial species (10)⁠.

When designing primers, there are two viable options. It is possible to review the literature and reuse primers which have been previously validated. However, it’s important to consider whether or not these primers are still valid, as new additions to 16S rRNA databases may reveal that previous primers are not as specific as once thought. Another option is using software such as ARD or PRIMROSE to design primers according to sequences for bacteria which appear in online databases of 16S rRNA gene sequences (2)⁠.

References


  1. Bartlett JMS, Stirling D. A short history of the polymerase chain reaction. Methods Mol Biol. 2003;226:3–6. 

  2. Osborn M a, Smith CJ. Molecular Microbial Ecology. Vol. 51. 2009. 370 p

  3. Van de Peer Y, Chapelle S, De Wachter R. A quantitative map of nucleotide substitution rates in bacterial rRNA. Nucleic Acids Res. 1996;24(17):3381–91. 

  4. Alm EW, Oerther DB, Larsen N, Stahl D a, Raskin L, Alm EW, et al. The oligonucleotide probe database . The Oligonucleotide Probe Database. 1996;62(10):3557–9. 

  5. Gong J, Forster RJ, Yu H, Chambers JR, Wheatcroft R, Sabour PM, et al. Molecular analysis of bacterial populations in the ileum of broiler chickens and comparison with bacteria in the cecum. 2002;1376:1–9. 

  6. Gong J, Forster RJ, Yu H, Chambers JR, Sabour PM, Wheatcroft R, et al. Diversity and phylogenetic analysis of bacteria in the mucosa of chicken ceca and comparison with bacteria in the cecal lumen. FEMS Microbiol Lett. 2002;208(1):1–7. 

  7. Lu J, Idris U, Harmon B, Maurer JJ, Lee MD, Hofacre C. Diversity and Succession of the Intestinal Bacterial Community of the Maturing Broiler Chicken Diversity and Succession of the Intestinal Bacterial Community of the Maturing Broiler Chicken. Appl Environ Microbiol. 2003;69(11):6816–24. 

  8. Gong J, Si W, Forster RJ, Huang R, Yu H, Yin Y, et al. 16S rRNA gene-based analysis of mucosa-associated bacterial community and phylogeny in the chicken gastrointestinal tracts: From crops to ceca. FEMS Microbiol Ecol. 2007;59(1):147–57. 

  9. Brosius J, Palmer ML, Kennedy PJ, Noller HF. Complete nucleotide sequence of a 16S ribosomal RNA gene from Escherichia coli. Proc Natl Acad Sci USA. 1978;75(10):4801–5.

  10. Chakravorty S, Helb D, Burday M, Connell N. A detailed analysis of 16S ribosomal RNA gene segments for the diagnosis of pathogenic bacteria. J Microbiol Methods. 2007;69(2):330–9. 

  11. Schmalenberger A, Schwieger F, Tebbe CC. Effect of Primers Hybridizing to Different Evolutionarily Conserved Regions of the Small-Subunit rRNA Gene in PCR-Based Microbial Community Analyses and Genetic Profiling. Appl Environ Microbiol. 2001;67(8):3557–63. 

Friday 11 November 2016

Sampling, Storing and Extracting DNA


The way in which DNA from a sample is handled and extracted from cells can introduce biases into the analysis of a microbial community. How it's done will differ depending on whether you're sampling from soil, ocean water, or faeces. I'm going to concentrate on sampling from gut contents and faeces.

Taking the sample

Working with chickens is far easier than working with people. They don't have the same social rules about a researcher waiting eagerly for them to produce a faecal sample. People tend to like to do their pooing in private, which adds an additional challenge to collecting samples. Person or poultry, the basic question remains the same: "How can I get this microbial community into a pot without contaminating it with the bacteria that are covering everything?"

There will be bacteria present in the air, on our hands and  our clothes so we need to consider how best to minimise these contaminants. The majority of studies I've read about the chicken intestinal microbiome don't give many details about how they took their samples. Some groups have removed the gastrointestinal tract, transferred them to individual sterile bags and kept them on ice until contents can be sampled in a cleaner environment such as a laboratory (1-4)⁠, but they don't give much more detail than that. 


A microbiome sequencing gut sample kit
Tony Webster from San Francisco, California, UBiome - Microbiome Sequencing Gut Bacteria Sample Kit (17238556660)CC BY 2.0
I don't think it's too much to imagine that you're a surgeon. During surgery, everything has to be as clean as possible, you, your equipment, your work surfaces. This is all to prevent bacterial contamination of your patient, so why shouldn't we extend the same to our samples? Sometimes we need to be even more careful, since even if you kill bacteria, although they can't grow, their DNA can still contribute to the sample. There was a good Reddit post dealing with this in the context of sterilising medical implants, but the general idea is the same.

When taking or handling samples, we can minimise contamination by using aseptic protocols. These include measures such as:
  • Wearing personal protective equipment (gowns, gloves, hair nets, face masks, etc.) to minimise contamination from skin, clothing and hair.
  • Using 70% ethanol to clean work benches and surfaces.
  • Working within a fume hood which can be treated with UV light between samples.
An example of personal protective equipment in a laboratory
Photo: U.S. Food and Drug Administration/Public Domain
The UV light goes back to what I was saying earlier about dead bacteria still being able to contribute DNA to samples. UV light damages and breaks down DNA, so it'll help to minimise this contamination. You can also soak any equipment you're going to reuse in 30% bleach for 30 minutes.

There are lots of ways to prevent contamination once the sample has got to the laboratory. If you want to read about them in more detail, there's a good link here about aseptic techniques.


Fresh Frozen Faeces

If DNA extraction can’t be carried out on fresh samples, then samples will have to be stored to stop damage to the DNA. The recommended method is direct freezing at -80°C (5)⁠. This doesn't affect the viability of the DNA, and you'll get similar results between fresh and frozen samples (6). There might actually be an advantage to freezing your samples. The ratio of Firmicutes to Bacteroides has been observed to change after sample freezing, with an increase in DNA from Firmicutes. The suspected cause is that freezing samples improves DNA extraction from gram-positive bacteria (7)⁠. However, this hasn't been replicated in all studies, so there's probably a variety of factors at play. There's even some information that suggests you can store faecal samples at room temperature for up to two weeks, and it won't significantly affect the bacteria that you find in the sample (8). Personally, I would reason that the faster you can extract the DNA the better, and if you can't extract the DNA it's probably better to freeze the sample just to be sure. 

If you can't beat them...

Now that we've got our sample, we've got to start thinking about how to analyse the DNA. At the moment it's locked up inside the bacteria and we can't get at it. So we need to pop (lyse) the bacteria. This sounds simple, but not all bacteria have the same anatomy. Some of them have tough cell walls (generally Gram-positive bacteria), and others are only protected by delicate cell membranes (generally Gram-negative bacteria).

To lyse bacteria, we can either use mechanical, chemical or enzymatic techniques. The success of chemical and enzymatic methods can vary greatly depending on the sample. The pH and other chemical conditions can affect the performance of chemical and enzymatic methods, so they're not brilliant for environmental samples (8)⁠. The most commonly used mechanical technique is beat beating, which does exactly what it says. The sample is vigorously shaken in the presence of small beads. The problem with this method is that the beads don't differentiate between cell walls, cell membranes and DNA. So once DNA has been released from the safety of its bacteria, it can be beaten up and broken down by the beads as well. This is called DNA shearing. The amount of DNA shearing depends on factors such as the time and intensity of beating; the size of the beads and the bead to sample ratio. It's important to keep DNA shearing to a minimum as small fragments of DNA can increase PCR artefacts (we'll come to that later!) (8)⁠. 

0.5mm Silica beads used in bead beating.
Photo by: Lilly_M, Zirconia-silica-bead, CC BY-SA 3.0

Luckily, there's a way round this. A repeated bead-beating (RBB) protocol has been developed which can help limit DNA shearing. First, you perform an initial round of bead beating. This lyses the more delicate Gram-negative bacteria. You can then remove the liquid portion (the lysate), which will contain the DNA from any lysed bacteria, before a second round of beat-beating takes places to lyse  the more resistant Gram-positive bacteria and archaea. This minimises the amount of damage done to DNA from fragile bacteria which would otherwise be subjected to extra beating (9)⁠. When compared to other methods, RBB has been shown to have a superior DNA extraction efficiency and provide the best bacterial diversity, especially with respect to archaea and Gram-positive bacteria (10,11)⁠.

Extracting

After cell lysis, the DNA has to be extracted. A wide variety of commercial kits are available, and each can introduce its own bias in terms of bacterial diversity and quality of DNA extracted (11,12)⁠. This makes the comparison of studies examining the microbiome difficult, as many will have used different DNA extraction techniques. There's also lots of home brew recipes available, but no one has done any comparative research with these. Apajalahti et al. described a method for lysis and extraction of DNA from ileal and caecal samples with reported cell lysis rates of >95% and > 99% respectively (13)⁠.

The final step of DNA extraction is purification which aims to remove PCR-inhibiting substances such as Dnases, polysaccharides and proteases which can interfere with the amplification of DNA (14)⁠. PCR inhibitors are present in chicken faecal and caecal samples, with a higher level detected in caecal samples, and they've also been found in human faeces (15)⁠. Commercially available DNA extraction kits contain steps which will help remove PCR inhibitors from samples (16)⁠, however there are additional steps which can be taken. The addition of non-acetylated bovine serum albumin (BSA) has been shown to partially overcome this inhibition, while polyethylene glycol (PEG) also facilitates PCR of faecal samples (15)⁠. T4 gene 32 protein has also been reported to reduce the inhibitory effects of contaminants (17)⁠.

Once DNA extraction is complete, you can estimate the quality of extracted DNA using agarose gel electrophoresis (18)⁠ and quantity using a spectrophotometre such as Nanodrop⁠. This step is especially important as DNA concentrations of a few to tens of picograms can cause random changes in PCR efficiency (19)⁠.

Once you've extracted you're DNA you're ready for the next step in the process, amplifying the DNA using PCR.

References:
1. Park SH, Lee SI, Ricke SC. Microbial populations in naked neck chicken ceca raised on pasture flock fed with commercial yeast cell wall prebiotics via an Illumina MiSeq platform. PLoS One. 2016;11(3):1–15. [PDF]
 
2. Ballou AL, Ali RA, Mendoza MA, Ellis JC, Hassan HM, Croom WJ, et al. Development of the Chick Microbiome: How Early Exposure Influences Future Microbial Diversity. Front Vet Sci 2016; 3:2.  [PDF]

3. Zhu XY, Zhong T, Pandya Y, Joerger RD. 16S rRNA-based analysis of microbiota from the cecum of broiler chickens. Appl Environ Microbiol. 2002;68(1):124–37. [PDF]
 
4. Amit-Romach E, Sklan D, Uni Z. Microflora Ecology of the Chicken Intestine Using 16S Ribosomal DNA Primers. Poult Sci. 2004;83:1093–8. [PDF]

5. Thomas V, Clark J, Doré J. Fecal microbiota analysis: an overview of sample collection methods and sequencing strategies. Future Microbiol. 2015;10(9):1485–504. [Abstract]

6. Fouhy F, Deane J, Rea MC, O’Sullivan Ó, Ross RP, O’Callaghan G, et al. The effects of freezing on faecal microbiota as determined using Miseq sequencing and culture-based investigations. PLoS One. 2015;10(3):1–13. [PDF]


7. Bahl MI, Bergström A, Licht TR. Freezing fecal samples prior to DNA extraction affects the Firmicutes to Bacteroidetes ratio determined by downstream quantitative PCR analysis. FEMS Microbiol Lett. 2012;329(2):193–7. [PDF]


8. Lauber CL, Zhou N, Gordon JI, Knight R, Fierer N. Effect of storage conditions on the assessment of bacterial community structure in soil and human-associated samples. FEMS Microbiol Lett. 2010;307(1):80–6. [PDF]


9. Stackebrandt E, Pukall R, Ulrichs G, Rheims H. Analysis of 16S rDNA clone libraries: part of the big picture. Proc 8th Int Symp Microb Ecol Microb Biosyst new Front Atl Canada Soc Microb Ecol Halifax, Nov Scotia, Canada. [PDF]


10. Osborn M a, Smith CJ. Molecular Microbial Ecology. Vol. 51. 2009. 370 p.


11.  Yu Z, Morrison M. Improved extraction of PCR-quality community DNA from digesta and fecal samples. Biotechniques. 2004;36(5):808–12. [PDF]


12. Salonen A, Nikkilä J, Jalanka-Tuovinen J, Immonen O, Rajilić-Stojanović M, Kekkonen RA, et al. Comparative analysis of fecal DNA extraction methods with phylogenetic microarray: Effective recovery of bacterial and archaeal DNA using mechanical cell lysis. J Microbiol Methods. 2010;81(2):127–34. [PDF]


13. Claassen S, du Toit E, Kaba M, Moodley C, Zar HJ, Nicol MP. A comparison of the efficiency of five different commercial DNA extraction kits for extraction of DNA from faecal samples. J Microbiol Methods. 2013;94(2):103–10. [PDF]


14. Mirsepasi H, Persson S, Struve C, Andersen LOB, Petersen AM, Krogfelt K. Microbial diversity in fecal samples depends on DNA extraction method: easyMag DNA extraction compared to QIAamp DNA stool mini kit extraction. BMC Res Notes. 2014; 7:50. [PDF]


15. Apajalahti JH, Särkilahti LK, Mäki BR, Heikkinen JP, Nurminen PH, Holben WE. Effective recovery of bacterial DNA and percent-guanine-plus-cytosine-based analysis of community structure in the gastrointestinal tract of broiler chickens. Appl Environ Microbiol. 1998;64(10):4084–8. [PDF]


16. Wilson IG. Inhibition and Facilitation of Nucleic Acid Amplification. Appl Environ Microbiol. 1997;63(10):3741–51. [PDF]


17. Rudi K, Høidal HK, Katla T, Johansen BK, Nordal J, Jakobsen KS. Direct Real-Time PCR Quantification of Campylobacter jejuni in Chicken Fecal and Cecal Samples by Integrated Cell Concentration and DNA Purification. Society. 2004;70(2):790–7. [PDF]


18. Grant W, Long P. Environmental microbiology; Methods and Protocols. 2014. 241 p.


19. Chandler DP, Fredrickson JK, Brockman FJ. Effect of PCR template concentration on the composition and distribution of total community 16S rDNA clone libraries. Mol Ecol. 1997;6(5):475–82. [PDF]